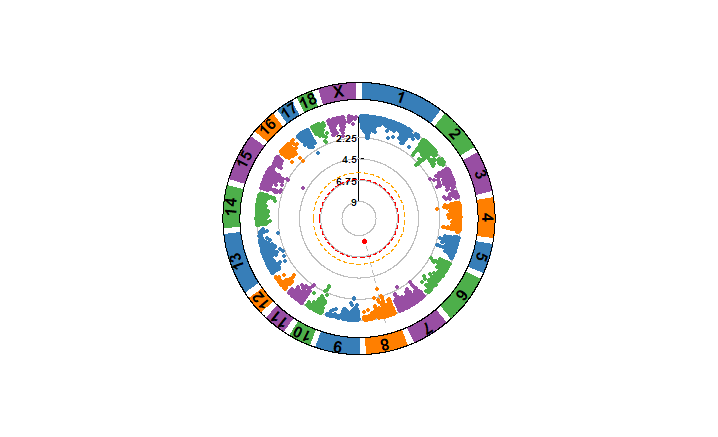
哈夫曼图 CMplot Posted on 2018-09-21 | In R | Visitors: 12345678910install.packages("CMplot")library("CMplot")data(pig60K) CMplot(pig60K[sample(1:nrow(pig60K),10000),c(1:4)],plot.type="c",threshold=c(0.01,0.05)/nrow(pig60K),threshold.col=c('red','orange'),multracks=FALSE, chr.den.col=NULL, file.output = F)