data science foll


  • Home

  • Tags

  • Categories

  • Archives

  • Search

一款有趣的IDE—RCode

Posted on 2018-10-01 | In R | Visitors:

RCode

main.gif

Directly edit your variables
Simple variables, lists, data frames… Inspect and edit everything.

variables.gif

Modern autocompletion
Analyse all your scripts to get the perfect autocompletion.
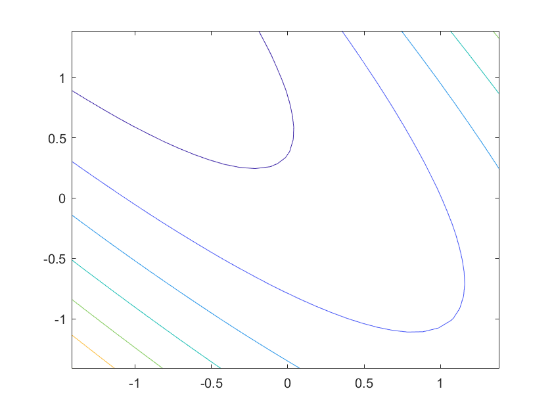
autocomp.gif

Fast graphs
Quickly visualize your data with a time series or a density graph.

graph.gif

Command history reinvented
Execution time for each command, and displayed in red if an error occurs.

history.gif

And more…

R语言自定义词云 wordcloud

Posted on 2018-09-30 | In R | Visitors:

wordcloud2 {wordcloud2} R Documentation

Create wordcloud by wordcloud2.js

Description

Function for Creating wordcloud by wordcloud2.js

Usage
1
2
3
4
5
6
wordcloud2(data, size = 1, minSize = 0, gridSize =  0,  
fontFamily = 'Segoe UI', fontWeight = 'bold',
color = 'random-dark', backgroundColor = "white",
minRotation = -pi/4, maxRotation = pi/4, shuffle = TRUE,
rotateRatio = 0.4, shape = 'circle', ellipticity = 0.65,
widgetsize = NULL, figPath = NULL, hoverFunction = NULL)
Arguments
data A data frame including word and freq in each column
size Font size, default is 1. The larger size means the bigger word.
minSize A character string of the subtitle
gridSize Size of the grid in pixels for marking the availability of the canvas the larger the grid size, the bigger the gap between words.
fontFamily Font to use.
fontWeight Font weight to use, e.g. normal, bold or 600
color color of the text, keyword ‘random-dark’ and ‘random-light’ can be used. color vector is also supported in this param
backgroundColor Color of the background.
minRotation If the word should rotate, the minimum rotation (in rad) the text should rotate.
maxRotation If the word should rotate, the maximum rotation (in rad) the text should rotate. Set the two value equal to keep all text in one angle.
shuffle Shuffle the points to draw so the result will be different each time for the same list and settings.
rotateRatio Probability for the word to rotate. Set the number to 1 to always rotate.
shape The shape of the “cloud” to draw. Can be a keyword present. Available presents are ‘circle’ (default), ‘cardioid’ (apple or heart shape curve, the most known polar equation), ‘diamond’ (alias of square), ‘triangle-forward’, ‘triangle’, ‘pentagon’, and ‘star’.
ellipticity degree of “flatness” of the shape wordcloud2.js should draw.
widgetsize size of the widgets
figPath The path to a figure used as a mask.
hoverFunction Callback to call when the cursor enters or leaves a region occupied by a word. A string of java script function.
Examples

library(wordcloud2)

1
2
3
4
5
6
7
8
9
10
11
12
13
14
15
16
17
18
19
20
21
22
23
24
25
26
27
28
29
30
31
# Global variables can go here


wordcloud2(demoFreq)
wordcloud2(demoFreq, size = 2)

wordcloud2(demoFreq, size = 1,shape = 'pentagon')
wordcloud2(demoFreq, size = 1,shape = 'star')

wordcloud2(demoFreq, size = 2,
color = "random-light", backgroundColor = "grey")

wordcloud2(demoFreq, size = 2, minRotation = -pi/2, maxRotation = -pi/2)
wordcloud2(demoFreq, size = 2, minRotation = -pi/6, maxRotation = -pi/6,
rotateRatio = 1)
wordcloud2(demoFreq, size = 2, minRotation = -pi/6, maxRotation = pi/6,
rotateRatio = 0.9)

wordcloud2(demoFreqC, size = 2,
color = "random-light", backgroundColor = "grey")
wordcloud2(demoFreqC, size = 2, minRotation = -pi/6, maxRotation = -pi/6,
rotateRatio = 1)

# Color Vector

colorVec = rep(c('red', 'skyblue'), length.out=nrow(demoFreq))
wordcloud2(demoFreq, color = colorVec, fontWeight = "bold")

wordcloud2(demoFreq,
color = ifelse(demoFreq[, 2] > 20, 'red', 'skyblue'))

这个包里面包含了两个数据集,demoFreqC 和 demoFreq,前者是一些中文数据,后者是一些英文数据。这两个数据都包含了两个变量,一个是文本,另一个是文本的数量。

1
2
3
4
5
6
7
8
9
10
11
wordcloud2(data, size = 1, minSize = 0, gridSize = 0,
fontFamily = 'Segoe UI',
fontWeight = 'bold',
color = 'random-dark',
backgroundColor = "white",
minRotation = -pi/4, maxRotation = pi/4,
shuffle = TRUE,
rotateRatio = 0.4,
shape = 'circle',
ellipticity = 0.65,
widgetsize = NULL, figPath = NULL, hoverFunction = NULL)

wordcloud2.jpg
wordcloud2提供了基本的词云功能,letterCloud可以使用选定的词绘制词云,这个词可以是英文,也可以是中文。
上面就是wordcloud2()函数,里面参数一大堆,但在一般情况下,我们却用不了那么多。其中data就是我们要处理的数据。shape参数可以选择词云的形状,有上面代码可知它默认为圆形(circle),它还提供了其他一些参数,cardioid(心形),star(星形),diamond(钻石形),triangle-forward(三角形),triangle(三角形),这两个三角形就是倾斜方向不同而已,pentagon(五边形);
size参数为字体的大小;
backgroundColor设置背景颜色,默认为白色,但有的时候黑色效果更好,颜色更能凸显出来。

1
wordcloud2(demoFreq)

demoFreq.jpg

1
wordcloud2(demoFreq, size = 1,shape='star')

star.jpg

1
2
example < -system.file("examples.png",package="wordcloud2")
wordcloud2(demoFreqC, size = 1, figPath = lexample)

bird.png

Google 镜像导航

Posted on 2018-09-28 | In Others | Visitors:

Google 镜像导航
http://ac.scmor.com/

Google.jpg

Color Hunt

Posted on 2018-09-26 | In Others | Visitors:

Color Hunt is a free and open platform for color inspiration with thousands of trendy hand-picked color palettes

colorhunt 虽为设计师而生,但也不妨作为一个令可视化图表更为好看的配色网站

colorhunt.co
colorhunt.jpg

SQL 教程

Posted on 2018-09-25 | In SQL | Visitors:

关于 W3School
W3School 是因特网上最大的 WEB 开发者资源
W3School 是完全免费的
W3School 是非盈利性的
W3School 一直在升级和更新
W3School 是 W3C 中国社区成员,致力于推广 W3C 标准技术

SQL教程
W3school SQL.jpg

R语言进行词云分析 jiebaR、wordcloud

Posted on 2018-09-25 | In R | Visitors:

jiebaR

jiebaR是一款高效的R语言中文分词包,底层使用的是C++,通过Rcpp进行调用很高效。jieba分词基于MIT协议,让R的可以方便的处理中文文本。jieba中文分词的R语言版本,支持最大概率法(Maximum Probability), 隐式马尔科夫模型(Hidden Markov Model), 索引模型(QuerySegment), 混合模型(MixSegment), 共四种分词模式, 同时有词性标注,关键词提取,文本Simhash相似度比较等功能。项目使用了Rcpp和CppJieba进行开发。

Wordcloud

Wordcloud包在做词语分析时并没有多大的作用,但是在后期的报告展示中却起着很大的作用。虽然说实质大于形式,在实质能够保证的前提下,一个好的形式是成功的关键点所在。Wordcloud包就是一个可以使词频以图形的形式展示的软件包,它可以通过改变词云的形状和颜色,是的分析结果锦上添花。

word.txt

1
2
3
4
5
6
7
8
9
10
11
12
13
14
library(jiebaRD)
library(jiebaR)
library(wordcloud)

#读入数据分隔符是‘\n’,字符编码是‘UTF-8’,what=''表示以字符串类型读入
word <- scan('C:\\Users\\10568\\Desktop\\word.txt',sep='\n',what='',encoding="GBK")
seg <- qseg[word] #使用qseg类型分词,并把结果保存到对象seg中
seg <- table(seg) #统计词频
length(seg) #查看处理完后剩余的词数
seg <- sort(seg, decreasing = TRUE)[1:100] #降序排序,并提取出现次数最多的前100个词语
data=data.frame(seg)
wordcloud(data$seg , data$Freq, colors = rainbow(100), random.order=F)
x11()
dev.off()

wordcloud.png

序贯设计及其应用

Posted on 2018-09-23 | In 试验设计 | Visitors:

1、 单因素优选法

设x为试验中最重要的因素或唯一的因素,并设其包含响应y的最优响应点的范围为 [a,b] .将响应y与因素x之间的关系写成数学表达式,不能写出表达式时,就要确定评估结果好坏的方法。令目标函数y=f(x)中不存在随机误差的情形。
黄金分割法:第一个试验点x_1设在范围 [a,b] 的0.618位置上,第二个试验点x_2取成x_1的对称点,即

用f(x_1)和f(x_2)分别表示x_1和x_2处的响应值.此时分为以下两种情形:
情形1:若f(x_1)比f(x_2)好,即x_1是好点,于是把试验区域[a, x_2)划去,剩下[x_2,b].
情形2:若f(x_1)比f(x_2)差,即x_2是好点,于是把试验区域(x_1,b]划去,剩下[a, x_1].

2、 响应曲面法

2.1、 最陡上升法

最陡上升法是一种使响应y朝最陡上升的方向序贯移动的方法.显然,若试验目的是使y最小化,那么该方法就变成了最陡下降法.当前试验点x的领域内的一些试验的数据,由最小二乘法得出拟合模型
……
响应曲面1.png
响应曲面2.png


原文太多数学公式了,markdown 编辑太麻烦,直接上传源文件算了, 等哪天找到 word 转 markdown ,数学公式不乱码再更新……

源文件点击下载

火山图 lattice

Posted on 2018-09-23 | In R | Visitors:
1
2
3
4
5
6
install.packages("lattice")
library(lattice)
head(volcano)
contourplot(volcano) # 绘制火山的三维等高线图
levelplot(volcano) # 绘制火山的三维水平图
wireframe(volcano) # 绘制火山的三维线框图

三维等高线图.jpg
三维水平图.jpg
三维线框图.jpg

网络图 igraph

Posted on 2018-09-23 | In R | Visitors:
1
2
3
4
5
install.packages("igraph")
library(igraph)
data=matrix(sample(0:1, 400, replace=TRUE, prob=c(0.8,0.2)), nrow=20)
network=graph_from_adjacency_matrix(data , mode='undirected', diag=F )
plot(network, layout=layout.sphere)

igraph.png

二维直方图 hexbin

Posted on 2018-09-23 | In R | Visitors:
1
2
3
4
5
6
7
8
9
install.packages("hexbin")
install.packages("RColorBrewer")
library(hexbin)
library(RColorBrewer)
x <- rnorm(mean=1.5, 5000)
y <- rnorm(mean=1.6, 5000)
bin<-hexbin(x, y, xbins=40)
my_colors=colorRampPalette(rev(brewer.pal(11,'Spectral')))
plot(bin, colramp=my_colors, legend=F)

hexbin.png

1…345…7
庞锦烽

庞锦烽

山高路远,道阻且长

61 posts
14 categories
90 tags
RSS
GitHub weibo
© 2018 — 2019 庞锦烽
Powered by Hexo
|
Theme — NexT.Muse v5.1.4