1 | install.packages("forecast") |

1 | install.packages("forecast") |
1 | install.packages("ellipse") |

1 | install.packages("dygraphs") |

1 | install.packages(corrgram) |

1
2
3
4
5
6cols <- colorRampPalette(c("darkgoldenrod4", "burlywood1",
"darkkhaki", "darkgreen"))
corrgram(mtcars, order=TRUE, col.regions=cols,
lower.panel=panel.shade,
upper.panel=panel.conf, text.panel=panel.txt,
main="A Corrgram (or Horse) of a Different Color")

1 | install.packages("iterators") |

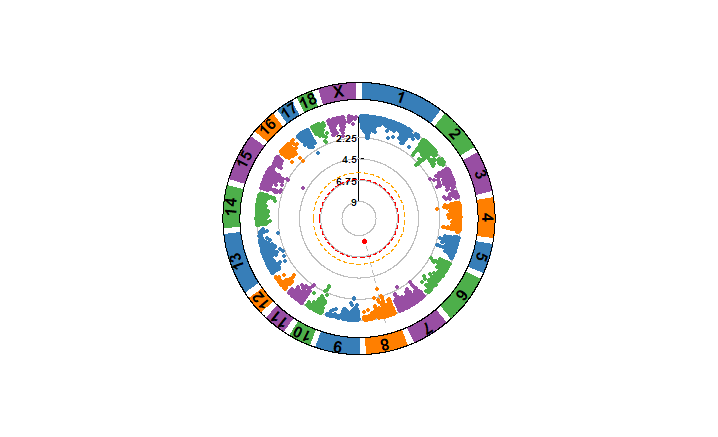
1 | install.packages("CMplot") |
为了将数据映射到0~1之间,去掉量纲的过程,让计算更加合理,不会因为量纲问题导致1米与100mm产生不同。
消除分布产生的度量偏差,例如:班级数学考试,数学成绩在90-100之间,语文成绩在60-100之间,那么,小明数学90,语文100,小花数学95,语文95,如何评价两个综合成绩好坏的数学处理方式。
scale(dt,center = T,scale = T)
scale方法中的两个参数center和scale的解释:
1.center和scale默认为真,即T或者TRUE
2.center为真表示数据中心化(只减去均值不做其他处理)
3.scale为真表示数据标准化